

Medical triple net lease fund · Series 3 now open
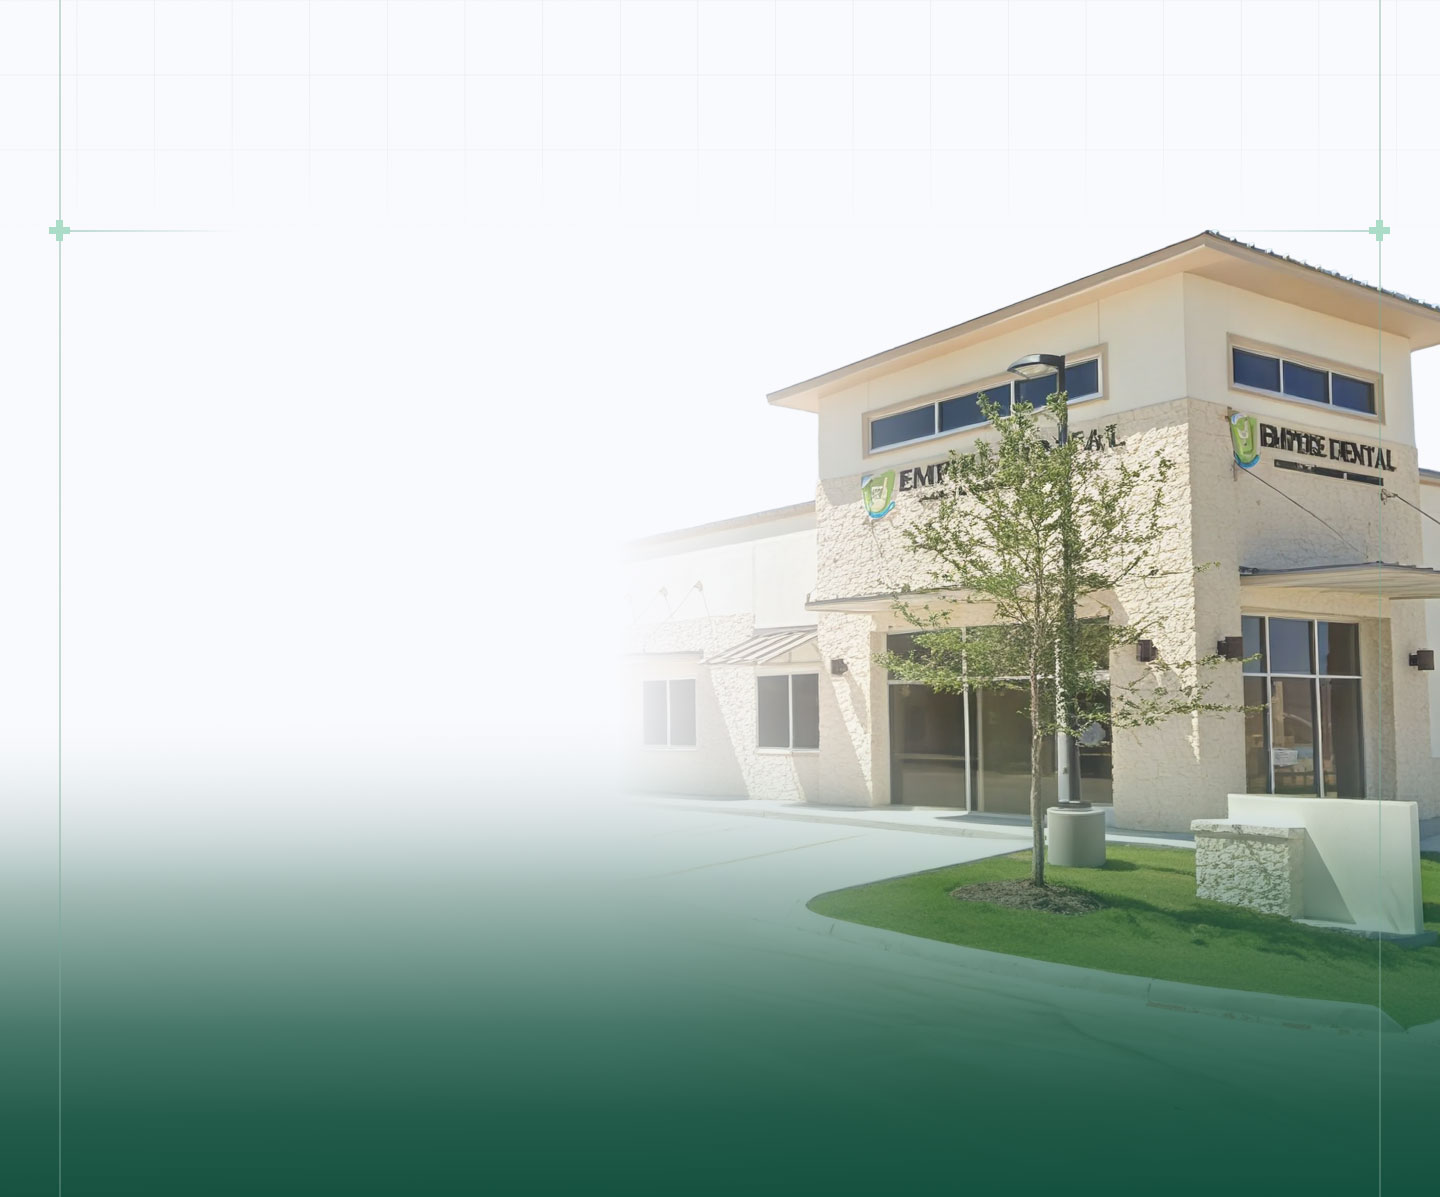

Medical triple net lease fund · Series 3 now open
Invest in the real estate behind
essential healthcare.
We acquire, manage, and fund recession-resistant dental
and medical buildings on long-term triple-net leases.
Assets Under Management
$150M+
Buildings
84
States
27
Target Distribution
7-8%
Targets are not guaranteed and actual results may differ. Past performance does not predict future results. Offered under Regulation D 506(c) to accredited investors only.
 Trusted by





Four ways to work with us
More than a fund. A platform
with four capabilities.

.01
Invest With Us
Access compelling, tax-advantaged medical real estate investments designed for accredited investors.

.02
Invest With Us
Nationwide property management for dental, veterinary, and medical real estate.

.03
Grow Your Healthcare Business
Strategic advisory services, industry expertise, and connections for healthcare entrepreneurs.

.04
Sell or Partner
With Us
Create liquidity from your real estate while preserving the flexibility to sell outright or participate in its future value.





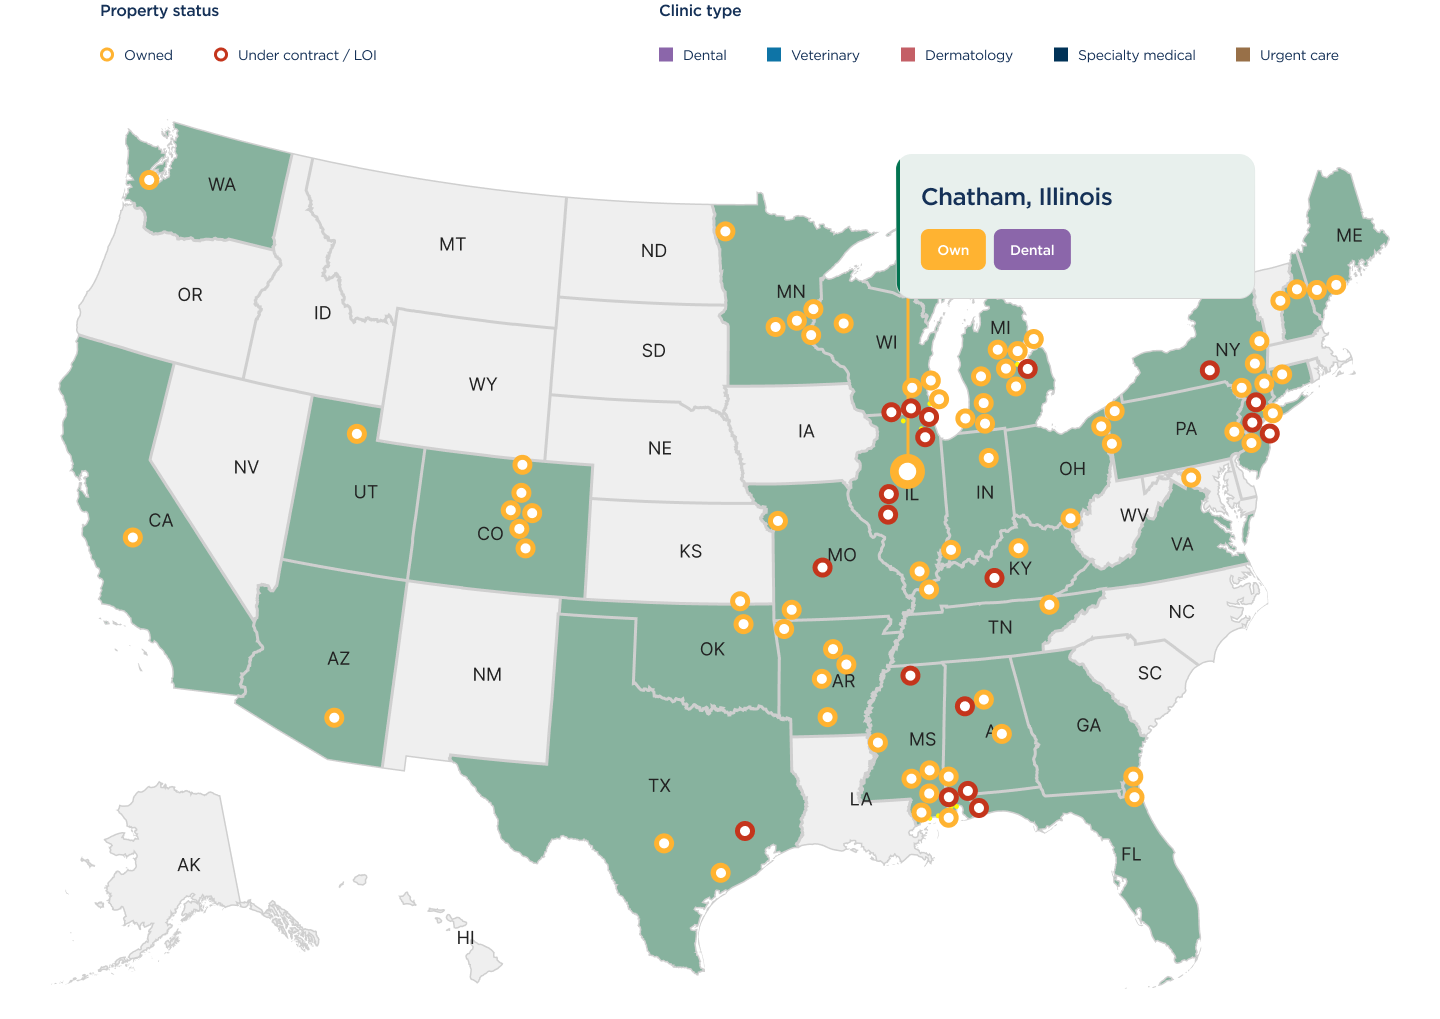
Our portfolio
A track record and portfolio
Buildings
84
States
27
Assets Under Management
$150M+
- Annual NOI
$10.3M
Tenant credit tier framework
96 tenants across 84 buildings · 3 healthcare categories
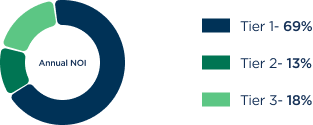
Tier 1
Parent revenue ≥$50M or named institutional PE sponsor
69% of NOI
57 buildings

Named institutional PE sponsors include Warburg Pincus, Linden Capital, Morgan Stanley Private Credit, Compass Group, Health Enterprise Partners, BlackRock, and Chicago Pacific Founders. Aggregate Tier 1 parent revenue exceeds $2.5 billion.
Tier 2
Parent revenue $25M–$50M, corporate financials on file
13% of NOI
8 buildings
Multi-site operators with corporate financials on file. Strong rent coverage ratios and corporate guarantees.
Tier 3
Practice-level financials only, parent revenue <$25M
18% of NOI
19 buildings
Practice-level financials only. Real estate fundamentals and sub-65% LTV are the primary credit anchor.
Tenant credit tier framework
96 tenants across 84 buildings · 3 healthcare categories
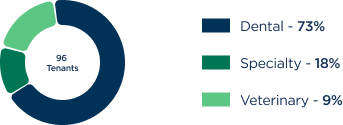
Dental
Incl. oral surgery, orthodontics, endodontics & pediatric dental
73% of NOI
64 Tenants
Specialty Medical
Plastic surgery, dermatology, orthopedic, urgent care & ancillary
18% of NOI
22 Tenants
Veterinary
Companion & specialty animal health
.
9% of NOI
10 Tenants
Predominantly PE-backed. Recession-resistant, non-discretionary demand.
Geographic footprint
84 buildings across 27 states · all four NAR regions
Midwest
41.3%

30 buildings · 19 owned · 11 pipeline
IL, IN, MI, MN, MO, OH, WI
South
29.7%

30 buildings · 19 owned · 11 pipeline
AL, AR, FL, KY, MS, OK, TN, TX, VA
Northeast
15.9%

14 buildings · 10 owned · 4 pipeline
CT, ME, NH, NJ, NY, PA
West
13.1%

10 buildings · 10 owned
AZ, CA, CO, UT, WA
Diversified across all four NAR regions with no single state above 13.0% of NOI — concentration risk stays low as the platform scales.

Our Offerings
7–8%
Average cash-on-cash
2.0x
Equity multiple
16–20%
Targeted IRR
25%–35%
Targeted IRR (upside)
5 Years
Holding Period
Targets are not guaranteed and actual results may differ. Past performance does not predict future results. Offered under Regulation D 506(c) to accredited investors only.

Find your Fit
Three Paths to Invest With Us


Targets are not guaranteed and actual results may differ. Past performance does not predict future results. Offered under Regulation D 506(c) to accredited investors only.

The Thesis
Three Paths to Invest With Us
Factor
Who pays expenses
Lease length
Tenant
Inflation protection
Tenant turnover
Management intensity
Triple-net medical
 Tenant pays taxes, insurance & maintenance (NNN)
10–15 years standard
Healthcare operators, many PE-backed
2–3% annual rent escalations built into the lease
Low — costly specialised build-outs keep tenants in place
Light — one tenant per building
Multifamily
Landlord absorbs operating costs
1–2 years standard
Individual households
Mark-to-market at renewal
Higher turnover is common
Heavy many units, many tenants


Investor’s Stories
Hear from the people investing alongside us.
From healthcare professionals to experienced executives, our investors value a disciplined approach to medical real estate, transparent communication, and a long-term partnership.


“He understands an old real estate adage that you make your profits on the buy, not the sell.”

Dr Lou T
Owner Orthodontist
“A.J. made it an easy choice to invest. The value of my investment has increased and it has provided passive income.”
Dr Tont. L.
Owner Dentist
“Quick, easy, and simple. The returns have been met. I would do it all over again.”
Dr. Scott F.
Owner Dentist
“We get to reap the rewards of commercial real estate without all the hassle, in a hands-off, stress-free manner.”
Dan N.
DoD Program Manager
“A.J. has been a transparent, patient, and thorough managing partner, guiding all of us through both periods of aggressive growth and prudent retrenchment.”
Sam S.
CFO, Latitude Food Allergy Care
Testimonials reflect the individual experiences of current investors and may not be representative of other investors’ experiences.
Targets are not guaranteed and actual results may differ. Past performance does not predict future results. Offered under Regulation D 506(c) to accredited investors only.
See your projected returns.
An illustration at the fund's target range (Series 3). Not a forecast or a promise of returns.
$100K minimum$2M
12%16–20% base case25%
2 yrs5 yrs
Year-one estimated paper loss
(cost segregation, ~60% of investment)
(cost segregation, ~60% of investment)
~$60,000
Projected total value at exit
$164,303
Equity multiple1.64x
Annual distributions
at 7% target
at 7% target
$7,000
Total distributions
over the hold
over the hold
$21,000
Proceeds at exit
(capital + appreciation)
(capital + appreciation)
$143,303
Value by yearTotal profit $64,303
Cumulative distributionsCapital and appreciation
Targets are not guaranteed and actual results may differ. Past performance does not predict future results. Offered under Regulation D 506(c) to accredited investors only.